Surveying tools
The basic tools for performing a wireless network survey are therefore a device that can measure signal and noise levels and calculate the signal/noise ratio, and a map of the area to record these values. Some survey tools are listed in References 5, 6, 7, 8, 9 and 10.
Signal, Noise, S/N Measurement
Although it is possible to survey a wireless network using signal strength or signal/noise ratio alone, it will be much easier to trace problems if measurements of signal, noise and signal/
noise ratio are available and recorded separately. If problems appear after a wireless network has been installed then it will be particularly important to determine whether these are due to a reduction in signal strength or an increase in noise level.
The most accurate tool for measuring radio signals is a dedicated radio frequency meter; however, results adequate for most purposes can be obtained using a wireless enabled laptop or PDA. Many of these come with a software application to display the current signal strength and noise level; for example, the signal strength meter provided with the Cisco® Aeronet® card is illustrated in Figure 4.
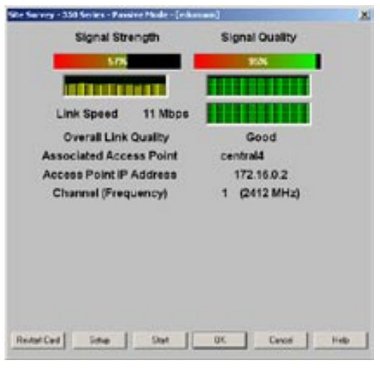
Figure 4: Cisco® Aeronet® Signal Strength Meter.
Other software applications may display additional useful information; for example the free Netstumbler program for Windows® shows the MAC address, wireless channel, protocol and (where available) SSID (service set identifier) of each access point within range (Figure 5). The Vendor field is derived from the first six octets of the MAC address, so it may be inaccurate for recently allocated addresses or where the access point allows its MAC address to be changed.

Figure 5: Netstumbler Listing Available Access Points.
Note that Netstumbler displays the current signal, noise and signal/noise ratio as well as the historical strongest signal (Signal+), weakest noise (Noise-) and greatest signal/noise ratio (SNR+). For surveying, these historical maxima and minima are the opposite of what is wanted: the weakest signal, strongest noise and least signal/noise ratio would be much more useful. For example the SNR+ value of 15 shown in Figure 5 might suggest that the network would be usable whereas the instantaneous value of 9 suggests that there are likely to be problems.
A better indication in conditions of poor reception can be obtained by Netstumbler’s graph of signal strength and noise level for an access point (Figure 6). Here the low and fluctuating signal strength and the low signal/noise ratio suggest that the network service is likely to be unreliable at this distance from the access point.

Figure 6: Netstumbler Signal Strength Graph.
A version of Netstumbler, called Ministumbler, is available for Pocket PC PDAs.
Wavemon and Kismet (Figures 7-8) are similar open-source tools for Linux® that can be used to list available networks, their signal strength and other characteristics. Kismet can also be used to capture packets and attempt to break WEP encryption keys: note that in the UK it would be a serious criminal offence to do this without the authorisation of the owner of the network.
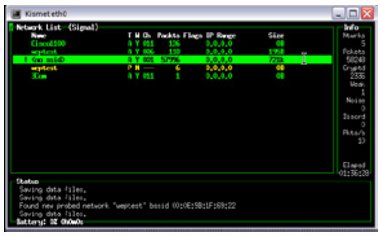
Figure 7: Kismet Listing Available Access Points.

Figure 8: Kismet Showing Access Point Characteristics.
Dedicated wireless network survey programs exist, and are capable of interpreting values such as signal strength and channel number to identify possible problems quickly. For example the AirMagnet™ program runs on either a Windows® laptop or PocketPC PDA, and provides diagnostics for the process of connecting to a wireless network (Figure 9, left), warnings of potential security issues (Figure 9, right), and the normal signal strength and other measures (Figure 9, centre).
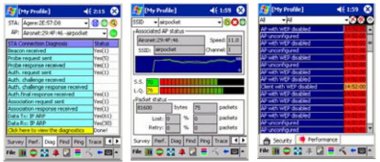
Figure 9: AirMagnet™ Diagnostic, Survey and Alarms Screens.
Whichever tool is used for the survey, the aim is to obtain values at points throughout the area covered by a wireless network for the poorest signal strength and highest noise level, to determine whether the performance of the network is likely to be adequate. When surveying with a laptop or PDA it should be used consistently, for example with the screen always open to the same extent and the same number of people around it (human bodies can significantly attenuate the wireless signal). However, at each point in the survey a number of different orientations should be tried to find the worst case signal. If you survey with your laptop carefully aligned to point directly at the access point, you can be sure that your users will randomly choose to sit in the worst possible alignment! For the same reason, when doing a survey, try to ensure that doors are shut, lights and equipment turned on, and the environment as hostile to wireless networks as it is likely to be in real use. If it is only possible to survey and install a wireless network when the building is empty during the vacation then adjustments are likely to be needed once people return.
Maps
The results of a wireless survey need to be related to the layout of the building. The easiest way to represent this is on a map. Floor plans of most buildings will exist somewhere: if there is no convenient electronic version then estates departments or site plans may provide a convenient starting point for copying. These may even give an early warning of likely sources of wireless noise (e.g. lift shafts and electrical plant rooms) or high signal attenuation (e.g. reinforced fire doors).
A wireless survey can be carried out using pencil and paper techniques, simply marking on the map the points where measurements were taken, writing in the signal strength or signal/noise ratio at each point and drawing rough contours of equal signal value by eye. This should certainly be sufficient to identify problem areas where there is either a high level of noise or a low level of signal. Figure 10 shows signal strengths measured using Netstumbler in an office area with two access points installed. The two dotted lines show the estimated boundaries where the signal strength from each access point drops below -70dBm – the level at which the available bandwidth is likely to be reduced. Throughout the area the noise level was found to be very low, below -95dBm, so the map of signal/noise ratio shows the same pattern.

Figure 10: Manual Survey Using Netstumbler.
Even from this basic survey (which took less than 30 minutes) it appears that the offices on the left side of the corridor by the swing doors may suffer from reduced performance, as the signals from both access points are close to the -70dBm limit. If sufficient frequencies are available, these offices might benefit from an additional access point. The meeting room on the right hand side of the plan was not a priority area, so the low signal strength in that area was not considered to be a problem.
Alternatively, computer mapping software can be used to input a scanned version of the base map and the measured values to produce a more professional looking contour map. Remember, however, that a contour map cannot reveal information it has not been given: signal strengths displayed in areas that have not actually been surveyed are at best a mathematical estimate and may be misleading.
Commercial software packages combine the data gathering and mapping processes; for example Ekahau’s Site Survey™ program (Figure 11) collects information as the person doing the survey walks round the building. Each time the person clicks on their current position on the map, the software records the signal strength and other parameters of all access points within range. This allows the software to build maps of wireless coverage, noise, data rate and channel overlaps, as well as suggesting locations for additional access points to improve coverage.

Figure 11: Ekahau Site Survey™.
Cisco®’s WLSE (Wireless LAN Solutions Engine) (Figure 12) allows an even simpler approach, where access points listen to the signals from each other to establish a map of signal strength. Once the locations of the access points are identified by clicking on the base map and the map scale is established by entering a measured distance, the access points themselves can generate an initial map of interpolated signal strength.
Figure 12: Cisco® WLSE Initial Map.
This can only provide an estimate of the signal in the spaces between the access points, so the system allows additional data points to be collected from a laptop carried around the area of coverage to give a more accurate map (Figure 13).

Figure 13: Cisco® WLSE Map with Data from Laptop.


