Network infrastructure
The university network is based on a Gigabit Ethernet backbone, linking together departmental Local Area Networks (LANs) which typically deliver switched 10/100Mbit/s to the desktop. The network is shown diagrammatically in Figure 1.
Figure 1: Schematic of the university network
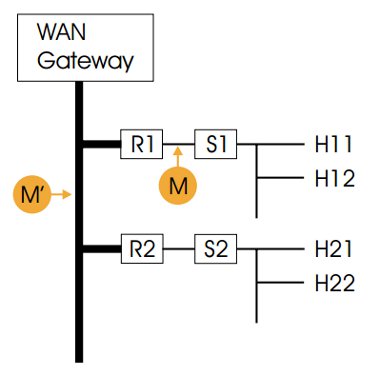
R1, R2 denote routers serving individual departments connected to the backbone.
S1, S2 represent Ethernet switches, and H11, H12, etc. individual hosts (in our case numbering over 10,000 machines).
M, M’ show the locations of the monitors.
We primarily use Cisco routers and switches, and routinely make use of the comprehensive logging facilities found in most of their equipment. On this occasion, however, we had little idea of the characteristics of the problem traffic, nor when it might occur again. Knowing only which departmental LAN contained the attacking systems, we chose to use a separate network monitor that could be configured to look for a wider range of anomalous behaviour, if necessary under programmatic control. But our first problem was how to monitor traffic in a switched environment.
Two options are normally available:
- use diagnostic facilities available in the switch to mirror all traffic to a single port, to which the monitor can be attached;
- connect a hub between the router interface and the switch, and then attach the monitor to a spare hub port.
Either approach can have an impact on network performance, and may cause packet loss. In the circumstances however (compromised hosts on the network), this is likely to be a relatively minor concern in the short term.
We went for a slight variation on the fi rst option. Cisco offers a Remote Switched Port ANalyser (RSPAN) feature that can tunnel mirrored traffic back through a number of intermediate switches and routers to a convenient location. In our case, leaving a monitor permanently sited in the machine room is much preferable to moving it around the university. Logically, this is still equivalent to attaching the monitor to point M in Figure 1.


